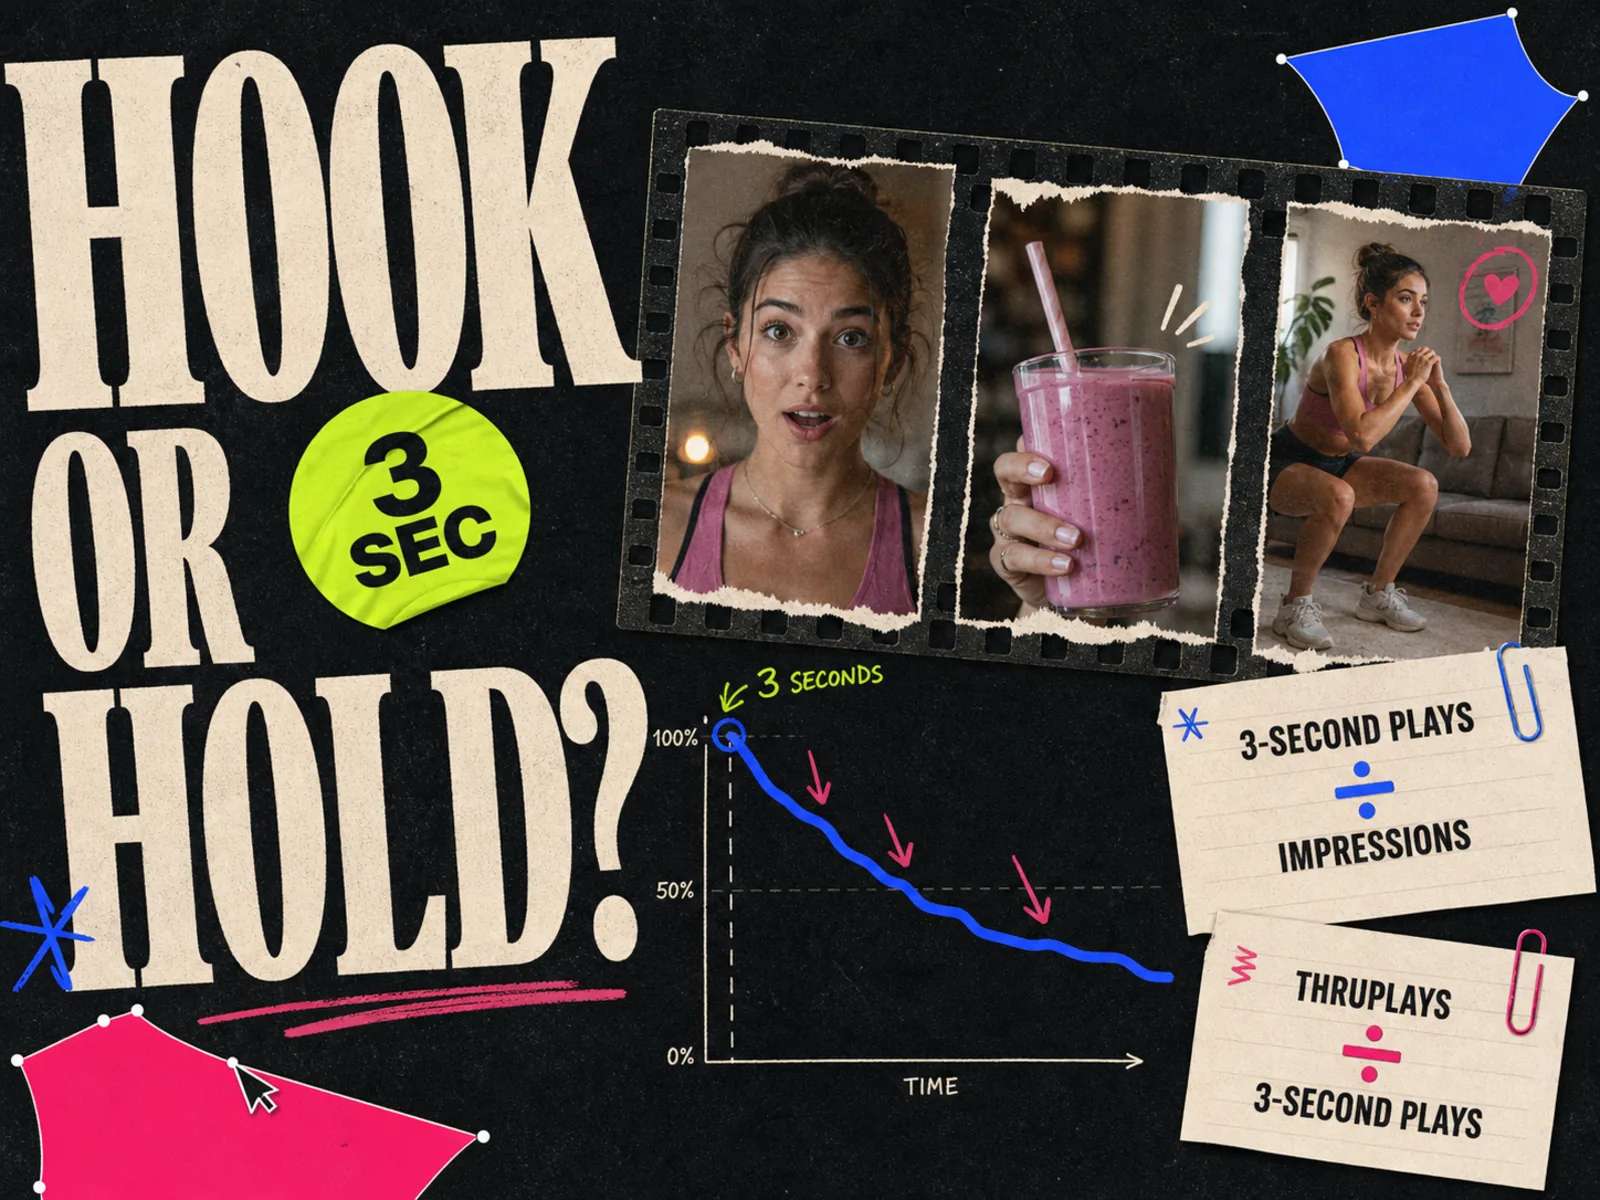
Thumbstop rate, hook rate, and hold rate sound like three separate Meta metrics. They are not. Meta reports the underlying counts, while advertisers turn those counts into ratios and give the ratios names.
That naming gets messy fast. Two dashboards can show different "hold rates" for the same ad because one divides ThruPlays by impressions and the other divides ThruPlays by 3-second plays. Neither calculation is useful until you know the formula.
A workable setup separates two questions: did the opening earn a watch, and did the rest of the video keep it? Use the same definitions across every ad you compare.
The short answer
Start here:
| Metric | Common formula | What it tells you |
|---|---|---|
| Thumbstop rate | 3-second video plays / impressions | Did the opening stop enough people to produce a short watch? |
| Hook rate | 3-second video plays / impressions | Did the first few seconds earn attention? |
| Hold rate | ThruPlays / 3-second video plays | Did people who started watching stay with the ad? |
With these definitions, thumbstop rate and hook rate are two names for the same calculation. Hold rate answers the next question.
This is a reporting convention, not a rule set by Meta. Some teams use two-second continuous video plays for thumbstop rate. Some divide ThruPlays by impressions and call the result hold rate. Write the formula beside the label so nobody has to guess.
What Meta actually reports
Meta does not provide standard Ads Manager columns named "thumbstop rate," "hook rate," or "hold rate." Those labels usually live in spreadsheets, reporting tools, or custom dashboards.
The raw Meta metrics behind them include:
- Impressions
- 3-second video plays or views
- Two-second continuous video views
- ThruPlays
- Video plays at different completion percentages
Meta defines a 3-second video view as a play of at least three seconds, or 97% of the video's length when the full video is shorter than three seconds. Meta's ThruPlay guidance describes a completed play for videos under 15 seconds and a play of at least 15 seconds for longer videos.
That difference matters. On a 10-second ad, a ThruPlay means the viewer reached the end. On a 30-second ad, it means the viewer reached 15 seconds, not necessarily the final frame.
Thumbstop rate vs hook rate
In day-to-day reporting, thumbstop rate and hook rate often use the same formula:
3-second video plays / impressions x 100
Suppose an ad records 40,000 impressions and 10,000 3-second plays:
10,000 / 40,000 x 100 = 25%
Call that 25% thumbstop rate or 25% hook rate. The number does not change.
The two names put slightly different language around the same event. "Thumbstop" focuses on feed behaviour. "Hook" focuses on the opening creative. The metric cannot prove that a person's thumb literally stopped, nor can it tell you which frame caused the watch. It only shows that a portion of impressions became 3-second plays.
Some teams deliberately separate the terms:
- Thumbstop rate = two-second continuous video views / impressions
- Hook rate = 3-second video plays / impressions
That can work, but only if the distinction helps your team make decisions. A second label that never changes the next edit is just dashboard furniture.
For the creative side of the problem, see the guide to advertising hooks and hook types. The glossary also has shorter definitions of hook rate and thumbstop rate.
Hold rate is where definitions split
Hold rate asks whether the people who began watching stayed for the body of the ad. A useful formula is:
ThruPlays / 3-second video plays x 100
If the same ad gets 10,000 3-second plays and 4,000 ThruPlays:
4,000 / 10,000 x 100 = 40%
Under this definition, 40% of the short-watch group made it to a ThruPlay.
You may also see:
- ThruPlays / impressions
- 15-second video plays / 3-second video plays
- Video plays at 25% or 50% / 3-second video plays
These ratios answer related but different questions. Dividing by impressions combines stopping power and retention in one number. Dividing by 3-second plays isolates what happened after the opening earned a watch. A percentage-completion formula adjusts the checkpoint to the video's length, which can make more sense when comparing videos that are not all 15 or 30 seconds long.
No formula wins by default. Pick the one that matches the question, name it plainly, and keep it fixed. The hold rate glossary entry is a quick reference for the 15-second or ThruPlay-over-3-second convention.
How to read hook rate and hold rate together
The pair is more useful than either number alone.
| Hook or thumbstop rate | Hold rate | Likely read | First edit to consider |
|---|---|---|---|
| Low | Low | The opening loses people, and the few who stay do not get a strong payoff | Rework the concept before polishing the cut |
| High | Low | The opening earns attention, but the body fails to deliver on it | Tighten the payoff, proof, pacing, or message match |
| Low | High | A small group likes the ad once it starts, but the first frame is not earning enough starts | Test a clearer first frame or opening line while keeping the body |
| High | High | The video earns and keeps attention | Check clicks, conversions, CPA, and revenue before scaling |
This table is diagnostic, not causal. A high hook rate does not prove that the opening caused a sale. A low hold rate does not prove that the edit is bad. Placement mix, audience temperature, campaign objective, video length, and delivery can all move the ratios.
Treat the pattern as a reason to inspect the ad, not a verdict delivered by the spreadsheet.
Do not use a universal "good" benchmark
A benchmark without context is usually a trap. A six-second Stories ad and a 45-second Feed testimonial do not have the same opportunity to earn a ThruPlay. A retargeting audience already knows the product. A cold audience does not. Different objectives can also change who receives the ad.
Build your benchmark from comparable ads in your own account:
- 1.Keep the placement mix similar.
- 2.Group videos by length range.
- 3.Separate cold prospecting from warm or existing-customer audiences.
- 4.Compare ads with the same objective and optimization event.
- 5.Use a long enough window that one small delivery burst does not decide the result.
The useful question is not "Is 28% good?" It is "How does 28% compare with our other 15-to-20-second prospecting videos in Reels and Feed?"
Meta itself recommends using the first few seconds deliberately and getting important messaging or branding into that opening. That is sound creative guidance. It is not evidence for one universal hook-rate target.
A clean reporting setup
Start with the raw counts. In Ads Manager or your reporting export, include impressions, 3-second video plays, ThruPlays, outbound clicks, the conversion event you optimize for, spend, and revenue if it is available and reliable.
Then add calculated columns:
| Calculated column | Formula |
|---|---|
| Hook rate | 3-second video plays / impressions |
| Hold rate | ThruPlays / 3-second video plays |
| Outbound CTR | Outbound clicks / impressions |
| Click-to-conversion rate | Conversions / outbound clicks |
Keep the full formula in the column description. "Hold rate v2" is not documentation.
If your team prefers two-second continuous views for the first ratio, rename the column to "2-second thumbstop rate." Now the report cannot silently swap denominators.
Turn the numbers into the next creative test
The ratios matter only when they change what you make next.
For a weak opening, keep the video's main argument and test the first few seconds:
- Start on the product result instead of the setup
- Replace a generic question with a specific customer problem
- Show the product in use before the logo animation
- Put the proof on screen while the viewer is still deciding whether to stay
For weak retention, keep the opening and edit the body:
- Pay off the opening claim sooner
- Remove repeated setup or dead frames
- Move the strongest proof ahead of secondary benefits
- Make the on-screen story readable without sound
Meta's video guidance notes that video can autoplay without sound and recommends using the opening seconds wisely. Those constraints make the first frame, captions, and early visual proof worth testing. They still do not tell you which version will win in your account.
Change one meaningful part at a time. If you replace the opening, creator, script, offer, music, and length in one edit, a better hold rate will not tell you what worked. The guide to how many Meta ad creatives to test explains how to size a batch around the budget available.
Attention metrics are not business outcomes
An entertaining opening can earn a strong hook rate and attract the wrong click. A curiosity gap can hold attention while hiding a weak offer. That is why hook and hold rates belong near, not above, outbound CTR, conversion rate, CPA, and revenue.
Read the funnel in order:
- 1.Did the ad earn a short watch?
- 2.Did it keep that watch?
- 3.Did viewers take the intended next step?
- 4.Did those actions turn into useful business results?
If the first two numbers look healthy but the last two do not, another hook edit may be busywork. Check the promise, offer, audience, landing page, and measurement before making ten more openings.
Where Adrio fits
Ads Manager should remain the source for delivery and outcome data. Adrio sits on the creative-production side of the loop.
When the data points to a message worth reusing, Adrio can help turn that message into controlled static concepts and export the sizes needed for Meta placements. When the opening or body needs a new idea, use competitor research and angle work to brief a genuinely different concept instead of making a cosmetic edit.
That gives the metrics a job: decide whether to keep the argument, change the opening, rebuild the body, or move on to another concept. For the broader production loop, see the Meta ad creative workflow and the difference between iteration and diversification.
FAQ
Is thumbstop rate the same as hook rate?
Often, yes. Many teams calculate both as 3-second video plays divided by impressions. Some use two-second continuous video views for thumbstop rate, so check the formula before comparing reports.
What is the hook rate formula for Meta ads?
A common formula is 3-second video plays divided by impressions, multiplied by 100. Meta reports the counts; "hook rate" is the name advertisers give the calculated ratio.
What is the hold rate formula?
A practical formula is ThruPlays divided by 3-second video plays, multiplied by 100. Other dashboards may divide ThruPlays by impressions or use a percentage-completion checkpoint. Label the denominator clearly.
What is a good hook rate or hold rate?
There is no universal number that works across placements, audiences, objectives, and video lengths. Build a benchmark from comparable ads in your own account and judge attention alongside clicks and conversions.
Why does my dashboard disagree with another reporting tool?
The tools may use different raw metrics or denominators under the same label. Compare the formulas, date range, attribution settings, placement filters, and data freshness before comparing the percentages.